The Hidden Cost of Not Knowing
Your Google Analytics dashboard shows that 60% of visitors bounce. It's a clean statistic. Cold and quantitative.
But it doesn't answer the question that matters: Why?
One visitor lands on your product page. They scroll to the middle. Then they leave. What happened? Did they find the price too high? Was the CTA button hard to see? Did something on the page confuse them? Did a browser error break their experience?
Google Analytics is silent.
Meanwhile, your competitors are watching the exact moment each visitor bounced. They see which elements get clicked, which get ignored, and which cause "rage clicks"—desperate attempts to interact with something broken. They watch session replays and see the full story of why 60% of visitors never convert.
The difference between you and them isn't intelligence. It's visibility.
Ready to get that visibility? Start your free 14-day trial with Plerdy — no credit card required. Installation takes 30 seconds.
The Visibility Gap: What Analytics Hide
Most businesses make decisions based on incomplete data.
Example: High Bounce Rate
-
Google Analytics says: "Bounce rate is 60%"
-
Plerdy shows: "Users see the headline, click nowhere, then leave. The hero image is broken on mobile. The form field has a validation error. The CTA button is below the fold."
Example: Low Conversion on Product Pages
-
Google Analytics says: "Only 3% of product page visitors add to cart"
-
Plerdy shows: "Users scroll down, click the product image repeatedly (rage click), then leave. The 'Add to Cart' button is hidden until they scroll past a video."
Example: Cart Abandonment
-
Google Analytics says: "40% of users abandon at checkout"
-
Plerdy shows: "Users hesitate at the payment method field. They click it 3 times, then leave. The field doesn't support their payment type."
This isn't a minor difference. It's the difference between guessing and knowing.
Research shows: Companies using heatmap and session replay tools see a 15-30% increase in conversion rates on average. Some see as high as 55%+.
That's not marginal improvement. That's the difference between a struggling website and a thriving one.
Part 1: The Three Data Layers Every Business Needs
Most CRO tools give you one layer: quantitative data (clicks, views, bounces).
Plerdy gives you three:
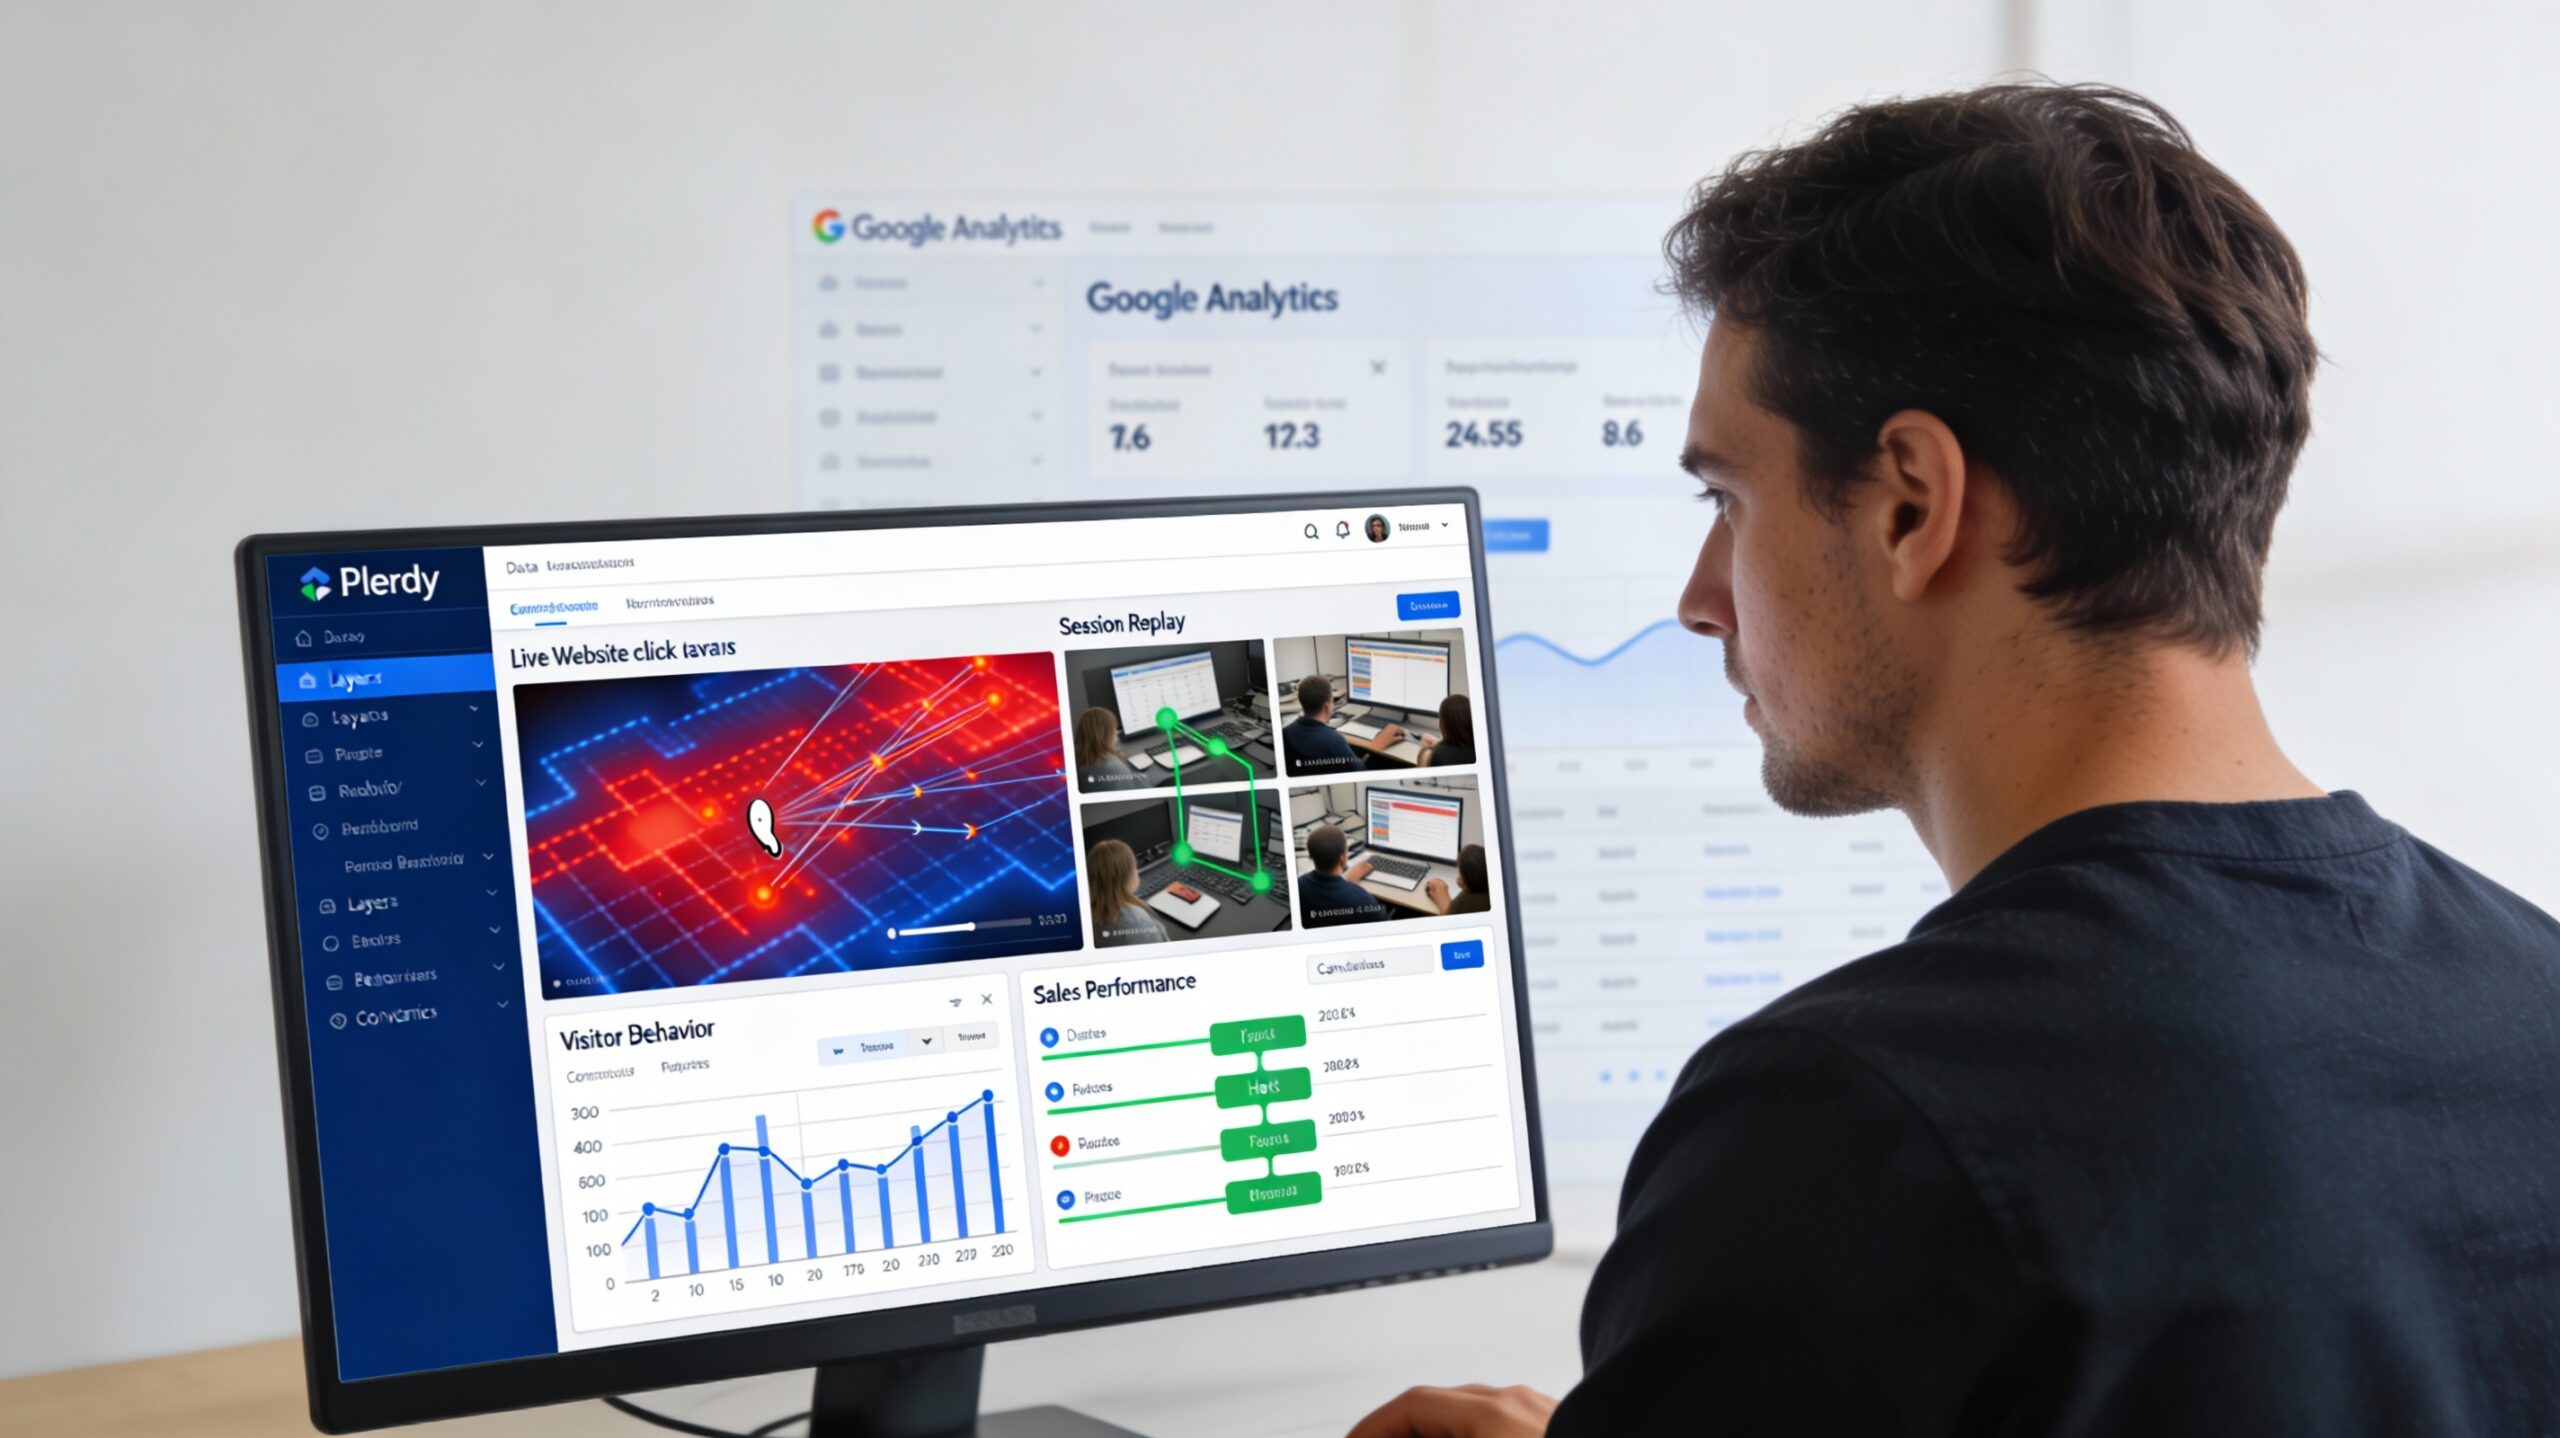
Layer 1: Behavioral Heatmaps (What Do Users Notice?)
A heatmap is a visual representation of where users click, how far they scroll, and where they move their mouse on your page.
Hot zones (red) = high activity. Cool zones (blue) = low activity.
This immediately reveals misalignment between what you think is important and what users actually care about.
Real example: An e-commerce site placed a high-margin product recommendation in a sidebar. Analytics showed nobody clicked it. The heatmap showed nobody even looked at it—their eyes went straight to the main product. By moving the recommendation above the fold, they increased upsells by 24.7%.
What Plerdy's heatmaps show that competitors miss:
-
Live site heatmaps (not screenshots)—see real visitor behavior in real-time
-
Click tracking: exactly where users click, how many times, and where they hesitate
-
Scroll depth: how far down pages users actually go
-
Mouse tracking: where eyes naturally drift (eye-tracking prediction)
-
Mobile heatmaps: separate data for phone vs desktop behavior
Why this matters: You can't optimize what you can't see. Heatmaps make the invisible visible.
Layer 2: Session Recordings (Why Did They Leave?)
A session recording is like watching a visitor's screen over their shoulder—except you can watch 100 recordings at once and identify patterns.
You see:
-
How they navigate your site
-
Which elements confuse them
-
Where they hesitate or click multiple times (frustration)
-
Why they abandon their cart
-
Technical errors they encounter
Real example: A checkout flow had a 42% abandonment rate. Session recordings showed that when users selected certain payment methods, the form broke silently. The user thought something was wrong with their payment info. By fixing the silent form error, abandonment dropped to 15%.
What makes Plerdy's session replay powerful:
-
Rage click detection: automatically highlights moments when users click repeatedly (sign of broken UX)
-
Form interaction tracking: see where users get stuck filling out forms
-
Error tracking: see technical errors that Google Analytics never reports
-
Mobile recording: watch how visitors actually use your site on phones
-
Masked sensitive data: recordings show user behavior without capturing passwords or card numbers
Why this matters: Session replays turn data into empathy. You stop guessing why people leave and start watching why.
Layer 3: Sales Performance Tracking (Which Elements Drive Revenue?)
Most analytics tools tell you what happened. Plerdy tells you which elements made money.
Traditional tools track clicks. Plerdy tracks conversions.
You can identify:
-
Which product image gets clicked by users who eventually buy vs. users who bounce
-
Which testimonial resonates with customers ready to purchase
-
Whether the "Free Shipping" badge influences purchasing decisions
-
Which checkout flow optimizations actually reduce abandonment
Real example: An online furniture retailer noticed high traffic but low conversion. Using Plerdy's sales performance tracking, they discovered that users who played product videos had a 3x higher purchase rate than users who just looked at images. By moving videos above the fold, conversion increased 34%.
What makes this unique to Plerdy:
-
Tracks the complete path from first click to purchase
-
Shows which page elements correlate with actual sales
-
E-commerce specific tracking (product views, cart additions, checkout steps, purchase confirmation)
-
Integrates with Shopify, Magento, WooCommerce to track actual revenue
-
AI-powered insights: automatically highlights the highest-impact elements
Why this matters: "What drives clicks" and "what drives sales" are different questions. Plerdy answers the one that matters.
Part 2: The ROI That Actually Justifies the Tool
Here's where theory becomes numbers.
Research-backed improvement rates from heatmap + session replay tools:
-
Average conversion rate increase: 20-30%
-
High performers: 50%+
-
Bounce rate reduction: 25-35%
-
Cart abandonment reduction: 15-25%
-
Average order value increase: 10-20%
Real ROI scenarios:
Scenario 1: E-commerce Store ($50K/month revenue)
-
Current conversion rate: 2%
-
With Plerdy-driven optimizations: 2.5% (+25%)
-
Monthly revenue increase: $10,000
-
Annual additional revenue: $120,000
-
Plerdy cost: ~$500/year
-
ROI: 240x
Scenario 2: SaaS Company ($100K/month in sales)
-
Current funnel converts 5% of trials to paid
-
Plerdy identifies why 40% of trial signups don't start trials (heatmap shows CTAs are missed)
-
Fix: Move CTA above fold
-
New conversion rate: 6% (+20%)
-
Monthly additional revenue: $20,000
-
Annual additional revenue: $240,000
-
Plerdy cost: ~$600/year
-
ROI: 400x
Scenario 3: Agency Website (Lead Generation)
-
Current contact form fill rate: 3% of visitors
-
Session replays show form has validation errors on mobile
-
Fix: Simplify mobile form
-
New form fill rate: 4% (+33%)
-
10,000 visitors/month → 100 additional leads/month
-
@ $100 per lead value: $10,000/month additional revenue
-
Plerdy cost: ~$400/month
-
ROI: 25x monthly (300x annually)
These aren't hypothetical. They're based on documented case studies.
Part 3: The Plerdy Feature Set (Everything in One Platform)
Most CRO stacks require 3-4 tools:
-
Hotjar (heatmaps, replay): $39+/month
-
Optimizely (A/B testing): $500+/month
-
Google Analytics: $150+ (GA4 premium) or free
-
Unbounce or Instapage (landing pages): $80+/month
Total: $800+/month minimum
Plerdy gives you all of this for $32-108/month.
Core Features Included
1. Heatmaps (All Types)
-
Click heatmaps: where users click
-
Scroll heatmaps: how far they scroll
-
Move heatmaps: where they move their mouse
-
Mobile-specific heatmaps: separate behavior for different devices
-
Real-time heatmaps: see live visitor behavior as it happens
2. Session Recordings & Rage Click Detection
-
Watch actual user sessions
-
Automatic rage click detection (identifies broken UX)
-
Form interaction tracking (see where users get stuck)
-
Mobile session recording included
-
Privacy-first masking (no sensitive data exposed)
3. E-commerce Sales Performance Tracking
-
Track which elements correlate with purchases
-
Shopify, Magento, WooCommerce integration
-
Monitor product page performance
-
Cart abandonment tracking with replay access
-
Checkout flow analysis
4. Conversion Funnel Analysis
-
Visualize the complete path from landing to purchase
-
Identify drop-off points
-
Segment by device, traffic source, behavior
-
Filter by actual conversions vs. bounces
5. AI-Powered Insights & Reports
-
Automatic anomaly detection
-
Suggested optimizations
-
Real-time alerts when performance drops
-
AI summarizes key patterns in recordings
6. A/B Testing
-
Built-in split testing for design changes
-
Results statistically validated
-
Integrated with heatmap data for context
7. Pop-up Forms & Smart Surveys
-
Exit-intent pop-ups to prevent abandonment
-
Targeted surveys to understand specific behaviors
-
Smart timing: show after user shows intent to leave
8. SEO Audit & Monitoring
-
Built-in SEO checker (unusual for CRO tools)
-
Tracks SEO metrics alongside conversion data
-
See how SEO optimizations affect user engagement
9. Real-time Analytics Dashboard
-
Live visitors on site
-
Active sessions with behavior details
-
Performance metrics updated in real-time
-
Mobile-responsive dashboard
10. Integrations
-
GA4 integration (import conversion events)
-
Shopify, Magento, WooCommerce
-
MailChimp, HubSpot
-
Zapier
-
Custom event tracking via API
Part 4: Implementation Framework (How to Actually Use Plerdy)
Having the tool is one thing. Using it to drive revenue is another.
Here's how to structure your optimization process:
Week 1: Baseline & Diagnostics
-
Install Plerdy (30-second setup, no developer needed)
-
Set up conversion goals (purchases, form fills, signups)
-
Enable e-commerce tracking (if applicable)
-
Create segments (mobile vs desktop, new vs returning, traffic source)
-
Gather 1 week of data
Week 2: Behavioral Analysis
-
Analyze heatmaps:
-
Which page sections get clicks?
-
Which get ignored?
-
Are CTAs in hot zones or cold zones?
-
-
Watch 20 session replays of users who bounced
-
What page elements do they interact with?
-
Where do they hesitate?
-
What errors do they encounter?
-
-
Identify top 3 problems (low engagement, confusion, technical errors)
Week 3: Sales Performance Audit
-
Compare converting vs non-converting sessions:
-
What elements do buyers click that non-buyers don't?
-
How far do buyers scroll?
-
Which page sections do buyers spend time on?
-
-
Analyze funnel drops:
-
Which step has highest abandonment?
-
Watch replays of people who quit at that step
-
Identify the specific friction point
-
-
Create hypothesis list:
-
"If we move CTA above fold, conversion will increase"
-
"If we fix form validation, cart abandonment decreases"
-
"If we add product videos, engagement increases"
-
Week 4-6: Test & Iterate
-
Pick highest-impact hypothesis (usually CTA placement, form friction, or technical errors)
-
Make change (can be small: move button, fix error, add element)
-
Run A/B test with Plerdy's built-in testing
-
Measure results (compare heatmaps, session behavior, conversion rate)
-
Iterate on next highest-impact item
Real results from this framework:
-
Week 1-4: Identify problems, fix major technical errors, move CTAs, simplify forms → 15-25% improvement
-
Week 4-12: Test design changes, copy changes, element positioning → additional 10-20% improvement
-
Ongoing: Quarterly optimization cycles → compound 50%+ improvement over a year
Part 5: Real Results (Proof From Customers)
E-commerce Case Study 1: Furniture Retailer
Challenge: High traffic, low conversion (2% on product pages)
Solution: Used Plerdy heatmaps to see "Add to Cart" button was below the fold, and session replays showed users clicking the product image instead of the button
Action: Repositioned CTA, added visual cues (hover effects)
Result: +24.7% conversion increase in 3 weeks
E-commerce Case Study 2: Multi-Product Store
Challenge: 40% cart abandonment
Solution: Session recordings revealed payment form had validation errors—users couldn't select certain payment methods without error
Action: Fixed form validation, simplified payment flow
Result: Cart abandonment dropped from 40% to 15%
SaaS Case Study: Product Card Optimization
Challenge: Product pages had high bounce rate despite high traffic
Solution: Heatmaps showed users weren't clicking CTA. Session replays showed users were confused about product features. Multiple CTAs in different places created paralysis.
Action: Redesigned product card with single clear CTA, added feature comparison
Result: Conversion increased 54.68%
Saraf Furniture: Multi-Phase Optimization
Challenge: Low conversion despite good traffic
Solution: Used Plerdy to identify multiple friction points:
-
Transaction rate from search: improved search algorithm based on heatmap data
-
Product page design: optimized button placement, added bonuses section
-
Navigation: improved product discovery
Results: -
Transaction rate increased 74.64%
-
Bounce rate decreased 3x
-
Conversion increased 27% (mobile), 14% (desktop)
-
Average revenue per user increased 51.69%
Infoshina: Iterative Button Testing
Challenge: Low checkout conversion
Solution: Used Plerdy to test button placement and design
-
"Buy" button repositioned: +85.57% CR
-
Restructured product page layout: +13.26% CR
-
Removed duplicate CTA: +14.8% CR
Cumulative result: Over 113% conversion increase through small, data-driven changes
Part 6: When to Use Plerdy (And When You Absolutely Need It)
You Should Use Plerdy If:
✅ You have website traffic but low conversion (e-commerce, SaaS, agencies, B2B)
✅ You have mobile bounce rates above 50%
✅ Your shopping cart abandonment is above 30%
✅ You don't know WHY visitors leave
✅ You want to reduce guesswork in optimization
✅ You're paying for traffic but not converting it efficiently
✅ You have multiple pages/funnels to optimize
✅ You want to understand user behavior without surveys
You Absolutely NEED Plerdy If:
🔴 You're running paid traffic (PPC, Facebook ads, email campaigns) but don't know where it's converting
🔴 You have high-value transactions (SaaS contracts, e-commerce orders over $100) and can't afford inefficiency
🔴 You're redesigning your website and want to validate assumptions before launch
🔴 You have a technical team building features but no visibility into how users actually use them
🔴 You're A/B testing changes but want to understand why one version wins
Part 7: Plerdy vs. The Alternatives
Hotjar (most common comparison)
-
Pros: Well-known, good heatmaps
-
Cons: $39+/month, session replay quality is lower, no e-commerce tracking, no SEO tools
-
Plerdy advantage: Same core features + SEO + sales tracking + lower price ($32-108 vs $39+)
Google Analytics 4 (what most use)
-
Pros: Free, massive feature set, integrates with everything
-
Cons: Shows what happened, not why. Can't see user recordings. No heatmaps. Requires coding expertise to set up properly.
-
Plerdy advantage: GA4 + behavioral context (heatmaps, replays, rage clicks)
Microsoft Clarity (free but limited)
-
Pros: Free
-
Cons: Very basic features, no e-commerce tracking, no advanced analytics, support is limited
-
Plerdy advantage: Professional-grade features, real support, integrations, pricing is still reasonable
VWO (enterprise-focused)
-
Pros: Powerful feature set, heavy customization
-
Cons: Expensive ($500+/month), steep learning curve, overkill for most businesses
-
Plerdy advantage: 90% of features at 10% of the cost
Plerdy's competitive edges:
-
Live site heatmaps (most competitors show screenshots)
-
Sales performance tracking (track revenue, not just clicks)
-
Rage click detection (automatic UX problem identification)
-
Built-in SEO tools (no other CRO tool has this)
-
E-commerce integration (track Shopify, Magento, WooCommerce sales)
-
Affordability (all-in-one at $32-108/month)
-
Installation speed (30 seconds, no developer needed)
-
No performance impact (script doesn't slow down your site)
Getting Started With Plerdy
Ready to stop guessing why visitors bounce and start watching exactly what happens?
Start your free 14-day trial with Plerdy — no credit card required. Installation takes 30 seconds.
You can also explore Plerdy on our partners page to see all features and understand how it fits your optimization strategy.
Beyond Plerdy: Your Complete CRO Stack
Plerdy solves the "why" of CRO. But a complete optimization program also includes:
-
A/B testing platform (Optimizely, Convert) → Test variations at scale
-
Email marketing → Follow up with abandoning visitors
-
Analytics (GA4) → Track the quantitative side alongside Plerdy's qualitative data
-
Customer surveys → Direct feedback to complement behavioral data
-
Content strategy → Align website content with user intent
Explore the complete CRO toolkit on saaspartout.com/marketplace. You'll find complementary tools for testing, email, analytics, and feedback.
Not sure which tools fit your optimization strategy? Use our AI Assistant to map your entire CRO stack.